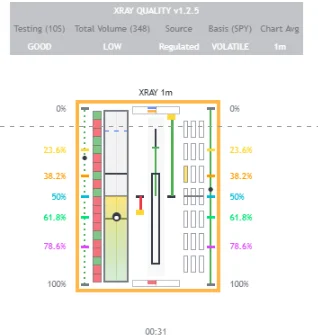
The complete volume flow analysis system. Real-time 10-second sampling, swing-based VSA, Flow Bands with squeeze detection, multi-timeframe modVWAP, basis tracking, and smart alerts — all in one powerful indicator.
Complete walkthrough of the XRayTrade Edge indicator
XRayTrade Edge combines six powerful analysis tools into one seamless indicator, giving you institutional-grade market insight.
Swing-based Volume Spread Analysis with effort vs result gradients
Session, Weekly, Monthly VWAP with 21-box confluence grid
Momentum/Volatility bands with squeeze detection
Identifies when smart money is absorbing orders
Futures vs cash divergence signals (Rich/Cheap/Volatile)
Opening Range Breakout with Price, Volume, and VWAP modes
Visual representation of cumulative volume flow showing net buying vs selling pressure at each price level.
Granular sampling captures micro-trends in volume that standard indicators completely miss.
Automatically adjusts to current swing highs and lows, highlighting key support and resistance zones.
Session, weekly, and monthly modVWAP tracked simultaneously, with panel markers showing where price sits against each.
Six built-in alerts: buy and sell signals, bullish and bearish absorption, and VSA effort/result anomalies — fired on the transition, not continuously.
Set your display size once for ES, NQ, or any symbol you add — Edge re-fits itself automatically every time you change charts.
| Setting | Default | Description |
|---|---|---|
| Core Engine Resolution | 10 seconds | Sampling interval for the live volume flow engine |
| Box Height Mode | Auto (per-instrument) | Display height chosen automatically by symbol — ES/MES and NQ/MNQ presets plus three custom symbol slots |
| Show Flow Bands on Chart | On | Master switch for squeeze-driven Flow Band lines and bias labels on the price chart |
| Show Squeeze Panel Column | On | Squeeze gradient column inside the XRay panel |
| Show modVWAP Lines on Chart | On | Session / weekly / monthly modVWAP lines on price |
| MA Signal System | On | Price-vs-core MA ribbon set with spread cloud, individually switchable |
| Session High/Low Lines | Off | Optional session extreme lines on the chart |
| Enable ORB | Off | Opening Range Breakout system — leave ORB Timezone on America/New_York when using Auto Start Time |
| Absorption Candle Fill | On | Colors candles when bullish or bearish absorption is detected |
| Alerts | 6 built-in | Buy/Sell signals, Bullish/Bearish absorption, VSA effort-result anomalies |
Edge's engine reads volume as it prints, at 10-second resolution. That live stream is where the absorption, imbalance, and effort readings come from — it's a live-tape tool first. On historical bars, charts carry summary data rather than the full tick-by-tick stream, so the panel is at full strength when the market is moving.
The core engine runs on any liquid symbol and chart timeframe. Session-based tools — session resets, ORB, session high/low lines — are tuned for CME futures hours, where Edge is at home on ES and NQ.
Edge's synthetic-tick engine is built on 10-second resolution data — that's what powers the live volume flow, absorption, and imbalance readings. TradingView includes seconds-based data on its Premium plan and above, so a Premium (or higher) subscription is required to access all indicator functions.
Premium or higher. Edge reads the market at 10-second resolution, and TradingView makes seconds-based data available starting at the Premium tier. Lower plans can't feed the engine the data it's built on.
Edge is published invite-only on TradingView. After checkout, we add your TradingView username to the access list — you'll have it within 24 hours, usually much sooner.
Any liquid symbol on TradingView. Edge ships with display presets for ES and NQ (micros included) plus custom slots for any symbol you trade, and it re-fits itself automatically when you switch charts.
Get instant access to XRayTrade Edge.