See momentum across 6 timeframes at once. Visual gradient fills show RSI and Stochastic levels with combined status and trend bias — completely free on TradingView.
Complete walkthrough of the MTF RSI + Stochastic Dashboard
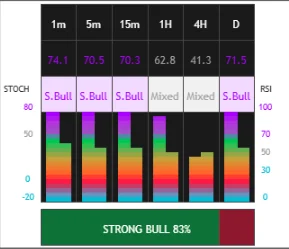
See RSI and Stochastic values for 1m, 5m, 15m, 1H, 4H, and Daily — all in one compact dashboard.
Intuitive gradient bars show intensity levels. Green for bullish, red for bearish, purple for overbought, cyan for oversold.
RSI and Stochastic are combined into a single status reading: Bull, Bear, OB (Overbought), OS (Oversold), or Neutral.
Horizontal bias bar shows overall market sentiment across all timeframes with percentage breakdown.
Adjust position, scale, colors, and timeframes to match your trading style and chart setup.
Get notified when all timeframes align bullish/bearish or when 80%+ confluence is reached.
Follow these simple steps to add the indicator to your charts:
Go to TradingView.com and open any chart
Click "Indicators" and search for "MTF RSI + Stochastic Dashboard"
Click the indicator by XRayTrade to add it to your chart — that's it!
The free RSI Dashboard is just the beginning. Upgrade to the full XRayTrade suite for institutional-grade volume analysis.