See 5 timeframes at once with relative scaling. Know exactly where price stands across multiple perspectives without switching charts.
Detailed walkthrough of the MTF Candle Preview indicator
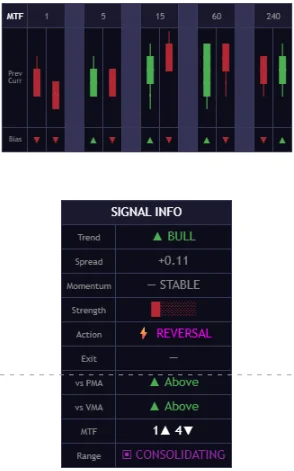
View 1m, 5m, 15m, 1H, and 4H candles (previous + current) with relative scaling for accurate comparison.
Price Moving Average vs Volume Moving Average spread monitoring. Detects trend direction, strength, and reversals.
Real-time dashboard showing Trend, Spread, Momentum, Strength bars, Trade Action, Exit warnings, and MTF alignment.
Automatic detection when PMA/VMA spread tightens. Visual boxes drawn on chart during consolidation phases.
Built-in core engine samples volume at 10-second resolution for Price at Volume calculation.
Buy/sell signals with cooldown, spread expansion/contraction alerts, and reversal zone detection.
| Setting | Default | Description |
|---|---|---|
| Timeframe 1 | 1 minute | First timeframe candle to display |
| Timeframe 2 | 5 minutes | Second timeframe candle to display |
| Timeframe 3 | 15 minutes | Third timeframe candle to display |
| Timeframe 4 | 1 hour | Fourth timeframe candle to display |
| Timeframe 5 | 4 hours | Fifth timeframe candle to display |
| Show Info Table | On | Toggle signal info table display |
Get instant access to the complete XRayTrade indicator suite.